Supporting Collaboration for choosing Holidays
Yvonne Rogers and John Halloran, The Open University
Summary
Have you ever been overloaded with information and choices when trying to buy a complex product, such as a cell phone package, a home entertainment system or a holiday of a lifetime? Imagine instead being able to walk into a store and making your purchase in an effiFient, informative and pleasurable way. The eSPACE project was concerned with helping agents and customers develop tailor-made products in the travel industry. An initial in-depth field study revealed how agents find it difficult to communicate and share information about the product while customers find it hard to piece together all the different aspects of the holiday experience. To overcome these problems we built an interactive collaborative travel planner that made it easy and enjoyable for both parties to find relevant information and plan a product. The fully functioning system was placed in trade shows across the world and a travel store receiving overwhelmingly favourable responses from customers and agents, alike.
1. Introduction
The eSPACE project ran for two years (2002-2004) and was funded by the British government as part of the ESRC/EPSRC PACCIT (People at the Centre of Communication and Information Technologies) Initiative (http://www.paccit.gla.ac.uk/public/projects/espace.php). It was a collaboration between computer scientists, cognitive scientists and HCI researchers at Sussex University and Nottingham University and consultants at Bridge The World Travel Company. The goal of the project was to develop an interactive planning system to support effective two-party transactions.
Initial observations of existing two-party transactions showed that when building a product, such as a round-the-world vacation package, many kinds of information are needed, in various forms and places (e.g., online booking systems, brochures, websites). However, it was also noted that the interaction is often dominated by the agent, working on his/her desktop PC, with the customer marooned on the other side of the desk, contributing very little to what goes on. Such an asymmetry was found to hinder progress and satisfaction with the transaction process. Both parties also experienced a degree of social awkwardness, sometimes feeling uncomfortable asking for certain kinds of information.
Our research was concerned with how to improve upon this situation by (i) empowering the customers, by making it possible for them to take a bigger part in the planning and decision-making process and (ii) enabling the agent to more effectively manage the transaction through the development and introduction of new ways of showing and explaining complex information. A key change was to provide better links between the different external representations needed for planning and product development to allow for more effective coordination of information. To inform our design solution we used the conceptual framework of external cognition (Scaife and Rogers, 1996) – that is outlined in chapter 3 of the book (section 3.4.4). An underlying assumption was that to improve collaborative interactions, especially joint planning, required changing the way information was displayed such that it could be more readily accessed, interacted with and shared.
To this end, we built an innovative shared workspace, called the eTable, and accompanying software, called the Oz Travel Planner, designed to support collaborative planning of travel in Australia, a destination specialised in by Bridge The World. It provided interlinked dynamic visualizations, contextually-relevant information for facilitating choosing and decision-making activities and user-centric interactive planning tools. The eTable was designed to have three embedded displays that were accessible by both parties. It also provided a novel way of physically partitioning information. The effect was to create a shared display system that small groups could sit or stand in front of, each seeing and being able to interact with the different kinds of information.
The eTable and travel planner were initially tested in a series of lab studies. They were then placed in trade shows across the world and extensively evaluated while being used for real at a travel agency for a long period. They were received favourably in the different settings: customers came away with a much clearer idea of their itinerary while consultants were able to explore a number of options with them in a more integrated way. For example, one consultant commented that the eTable enabled her to ‘draw the customer in’ by providing an attractive vicarious experience of the holiday. “It’s much easier to sell when the client can see everything, they get excited when it starts taking shape.”
The case study describes the different stages of the design process. Section 2 provides relevant findings from the literature. Section 3 presents an overview of the findings from the ethnographic study. Section 4 lists the requirements for the proposed travel planner system. Sections 5 and 6 describe the design of the low and high tech prototypes, respectively, detailing how the system was intended to work. Section 7 presents the findings from the various evaluations of the system when used in real world settings. Finally, section 8 discusses the implications of the eSPACE project more generally in terms of topical research and design concerns.
2. Background
A number of ethnographic studies have shown that the role of technology in face-to-face consultations can be problematic. For example, studies in the banking sector (Hughes et al, 1999) and medical consultation (Heath and Luff, 2000) have suggested that the physical layout of technology can inhibit the interactions between the parties involved. Consultants (e.g., agent, doctor, receptionist) sit behind one side of a desk, retrieving and displaying information on their PC, with the other party typically sits uncomfortably on the other side, staring at the back of the computer. The arrangement has the effect of restricting access to information primarily to the person in front of the computer and in so doing making it difficult for the other person to become engaged in the collaboration, even if both parties are willing. To overcome these problems Luff and Jirotka (1998) suggest a number of design implications for future technologies based on how co-located groups use everyday interactional resources to coordinate their collaborative and social activities.
There has also been much interest in configuring physical spaces, such as meeting rooms, offices, homes, and public buildings, with networked technologies to support new ways of collaborative working, socializing, and living. One approach has been to embed various displays and technologies in the space to literally become part of the furniture. Early efforts included the Electronic Meeting System (Stefik et al, 1987) and the Arizona project (Nunamaker, 1991) where a number of special-purpose large scale meeting rooms were built to facilitate organizational meetings. More recently, UbiComp researchers have begun experimenting with smaller scale and more intimate meeting rooms, using a range of embedded displays and interlinked technologies, including the iRoom (Johanson et al, 2002) and I-Land (Streitz et al, 1999, 2002). Interactive shared tabletops, such as DiamondTouch (Dietz and Leigh, 2001), have been developed that can recognize touch input from multiple users. Various combinations of surfaces (i.e., displays, devices and tangibles) have been experimented with and distributed throughout a room to investigate flexible work settings (e.g., Rogers et al, 2006; Shen et al, 2006).
User studies have also begun identifying the benefits of having information appear on more than one display (e.g., Grudin, 2001; Hascoet and Sacks, 2002). These include helping users keep track of, and manage, multiple tasks, for example, placing core tasks on a central screen with less important tasks and associated information on peripheral displays. However, it has also been found that dividing one’s attention between displays can sometimes slow down user performance for certain kinds of tasks (Tan and Czerwinski, 2003).
A key research question that the eSPACE project addressed was how best to design shared physical and technological workspaces to support effective small group collaboration. To this end, our research looked at how to combine, place and embed various technologies within the physical environment. We also experimented with different kinds of external representations and in particular how best to integrate them. To begin, it required us initially to understand how groups work together, socially, cognitively and physically (Greenbaum and Kyng, 1991) when around, besides, and at different surfaces.
3. Ethnographic study
To more fully understand the nature of the problems involved in face-to-face consultations we carried out a detailed six-month ethnographic study, observing and video recording a number of different sales-based transactions that took place at various travel companies, following the different stages involved in building a round-the-world trip. We also interviewed customers and agents about their strategies and the problems they encountered. Here, we present some of our salient findings of what happens during the beginning stages of a transaction, which is where most problems arise. We focus on how customers and agents physically interact and communicate during initial face-to-face consultations and the information representations that are used.
The technological set-up in a travel agency is designed primarily to support the agent to do their job, rather than the customer. This asymmetry is manifested both in the physical arrangement of technologies and the representations available and used by each party.
3.1 Physical asymmetry
In all the travel agencies we visited, the PC was positioned in front of the agent, who uses it to do their tasks, such as looking up flight availability or special offers, and filling in booking forms. When the customer first enters a travel agency, they have to sit on the opposite side of the agent’s desk, largely unable to see what the agent is doing or what is appearing on their screen, unless they peer over or the agent swivels the computer monitor around for them to see. The default mode of interaction is for the agent to talk to the customer around the PC monitor and only occasionally turn their screen towards the customer. Figure 1 shows a typical set-up – the agent is immersed in a world of information they are querying as part of the consultation, which the customer cannot see. This has two effects:
- The arrangement is socially awkward with the technology setting up a barrier to collaboration
- Time is spent when the customer is waiting doing nothing and is not being communicated with by the agent
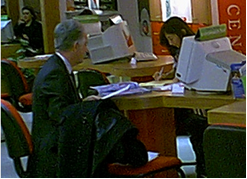
Figure 1. A typical arrangement of technology at a travel agency
3.2 Representational asymmetry
Much of the initial transactional process involves accessing and making decisions about certain kinds of information (e.g., flights, hotels, dates, cost) presented as a series of separate representations. Some of these, notably brochures, are specifically for customers to use while they work up an initial plan. Others, including online booking forms and product databases, can, in contrast, only be accessed, understood and operated by agents, and must be used to translate the customer’s ideas into a quote.
What this means in practice, is that much of the interaction that takes place during a transaction involves translating representations between the agent and customer (see figure 2). On the one hand, customer-geared representations need to be translated into a form that the agent can work with when interacting with the various computer-based systems, and on the other, system-based representations have to be translated into a form that customers can understand.
Hence, it is not surprising to find the representations that are created by the agent and customers during the transaction are also different. For example, the customer’s way of initially representing their proposed plan is chronologically, in terms of when and how long they want to spend at a place. In contrast, the agent needs to represent the customer’s plan as an itinerary, which has to be formatted in terms of ‘product types’, according to the order different products can be booked (typically flights are booked first, followed by hotels, followed by other ‘land sales’ like hire cars or tours). This requirement is always implicit, so customers may, despite writing down a detailed plan, produce something that requires much working up by the agent.
In addition we found that agents often find it difficult to communicate and share their information with customers because of the translation overheads. They have to verbalise the codes and data they are viewing on the screen into a language that the customers can follow and understand. Customers can find it difficult to piece together all the different aspects of the holiday experience that are being relayed. Both parties can feel frustrated by the initial conversations.
Figure 2. Different types of information used by the agent and customer to build up a travel product
How can we improve upon this situation? Our goal was to reduce the identified asymmetries and in so doing enhance the initial consultation by making it:
- more equitable
- more collaborative
- more enjoyable
4. Requirements
An obvious design solution would have been to create a web-based application that customers could use to explore possible vacations in the comfort of their own home or public space. A number of web-based interactive travel planners have been built. However, they have not been successful. One of the reasons is that many decisions and choices have to be made that need to meet certain criteria when building up high end products like a round the world trip. Considerable human expertise is normally involved (via the travel agent) which is not easy to automate as part of a computer-based application. Furthermore, customers generally prefer human experts helping them when making a complex set of decisions.
Alternatively, we chose to look at the way the travel agency works and consider how to change core social, cognitive, physical and technological components to enhance the transactional process. We decided to:
(i) Change the technology
- Improve the physical arrangement and workspace to support more collaboration
(ii) Change the information
- Provide planning representations and shared informational resources that can be readily understood and interacted with by both customer and agent
- Support better integration of the different representations used by both parties to build up a product
- Explicitly represent constraints and parameters as external representations in a way that their relations can be clearly perceived
(iii) Reduce social awkwardness
- Allow subtle ways of exploring sensitive issues through new forms of ambient visualizations
Our anticipated outcomes were:
- Empower the customer by enabling them to take a more active part in the initial stages of planning
- Reduce translation costs and, in so doing, the cognitive effort required to understand and develop a product
- Enable the customer and agent to plan synchronously and in a complementary way
- Reduce cognitive effort involved in the planning process through using external representations that enable more possibilities and permutations to be explored
5. Design: Lo-tech prototypes
The field study revealed that one reason why it is hard to keep track of a product as it develops during the initial consultation is that there are not any shared external representations that can be referred to. Rather, the product is largely represented at this stage by the verbal medium. As we saw, this creates cognitive load problems attendant on tracking the product by means of one modality – talk – not least because of the need to deal with multiple constraints and parameters at the same time. How might we represent such complex data that does not make excessive cognitive demands? We decided to investigate the use of information visualizations as:
(a) they can provide a persistent trace of what is being discussed, reducing demands on working memory
(b) they can provide the potential for integrating a number of variables that can be read off and assimilated relatively easily
(c) canonical visual representations, such as maps, are highly familiar forms that are used to represent geographical information in a spatial way
(d) visual metaphors can be used to depict abstract and dynamic data (e.g., clocks, lines, thermometers) in a more concrete way
5.1 Multiple or composite visualizations?
Our central design concept was a map-based planner visualization that different products (e.g., flights, hotels, car drive) could be added to. Other visualizations showing the timeline and budget would be displayed adjacent to this. The aim was to convey all of the relevant parameters simultaneously and in an understandable visual form to enable customers to move between them with minimal cognitive effort when making decisions about which hotels to stay in, which places to visit, etc. We also wanted both parties to be able to easily communicate through the visualizations aspects of the product as it was being created.
To begin, we designed a number of different visualizations using paper prototypes (see Figure 3). The map-based planner visualization (Figure 3a) was designed so that it could be interacted with via direct manipulation techniques to explore possible itineraries and options. The map is a familiar canonical form that is easily read and made sense of. Our idea was to enable customers to plan a route between different destinations by drawing lines between them. The traces made would enable them to see at a glance where they were planning to go and also to easily change components in the route if they changed their mind.
We arrived at this prototype on the basis of experiments in a lab setting where we gave participants a budget and a brochure, as well as a list of destinations to be included (in any order) over a given time period, and asked them to use just pen and paper to work out a solution. We found that the participants mainly came up with a chronological list, which had to be crossed out and recopied as it expanded and changed. We felt we needed to allow erasing and moving of information. At the same time, we found that participants often referred to the maps given in the front of the brochure showing the whole country, and would flip between this and specific information elsewhere in the brochure. Thus we felt that a map-based representation allowing flexible annotation was needed.
To mock up this kind of interactivity we covered a paper-based map with a transparent film on which components (e.g., internal flights, hotels) of the trip could be drawn with a felt pen. In a further user study, participants were asked to draw a route of where they would like to go and by which means of transport given the same brochure, budget and timescale, so a similar task to that described above, but given different representational support. This proved to be a more straightforward task; they also found it easy to make changes if they decided later to switch their destinations (e.g., fly from Sydney to Melbourne instead of Sydney to Brisbane).
Figure 3. Examples of the paper prototypes designed to represent core dimensions when planning a trip: (a) map planner, (b) timeline, (c) pie chart of budget, (d) thermometer showing budget and time (e) composite visualization of budget and timeline
Because our participants clearly showed preferences not just for maps but also for chronological representations, the second prototype was designed to represent the timeline for the planned trip in a form that could be easy to fill in and reconfigure. Figure 3b shows one of our designs where the weeks are divided into days with spaces left for text descriptions to be added of the different components of the trip. Participants in our user study had little problem understanding the format and the way it was filled in. The third prototype was designed to represent the proposed budget (Figure 3c and d). We experimented with two different metaphors: a pie chart where slices represent the price of each component as a proportion of total budget available and a thermometer showing the budget rising and falling as products are added to or removed from the itinerary. The thermometer indicates the amount currently spent whereas the pie chart shows explicitly the amount spent so far relative to a fixed total budget specified by the customer at the start of the transaction. When both prototypes were shown to the agents they pointed out that sometimes they like to show their customers what else they can have if they were to spend, say, another £50 or so on a particular product or set of products. They preferred the thermometer representation for this reason – since total budget available was implicit and could be changed. Our participants also found it easier to read at a glance than the pie chart representation.
We also added a simple timeline on the other side of the thermometer metaphor to show how many weeks had been planned for relative to the amount of budget. Participants were able to readily read off that they had spent x number of pounds for Y number of weeks, giving them a rough estimate. However, it did not provide the level of detail that customers and agents wanted when making further choices. Our subsequent designs of the timeline variable included more detail about its constituent components.
The timeline and budget visualizations were intended to update automatically according to the user interactions taking place via the map planner. A change in the state of the map (for example, adding a hotel to a destination) would be associated with an automated change to the timeline (text is added to show what the component is and when it occurs) and updating the amount of budget spent. The objective for making this dynamic process automatic was that it would reduce the cognitive effort required by the agent or customer as neither would have to calculate or remember what had just been spent or chosen. However, the various visualizations still need to be integrated by the customer or agent to see the relations between the different variables. The relationship of cost to time, or cost to location, for example, could only be worked out by examining the different visualizations at different points in space. We decided, therefore, to explore whether the cognitive effort required could be lessened by using a representation that integrates the different variables in the same visualization. An example is shown in Figure 3e. In this composite visualization the map is augmented by a three-dimensional sail. The rising height of the sail represents time elapsed; the wedges are time sections, and the rectilinear sections are amount spent.
However, the sail metaphor proved too complex and too novel - to be read by our participants without having had any a priori training. It actually required more cognitive effort to make sense of than the separate visualizations. There were also occlusion problems, including difficulty in reading destinations, and issues with accurately registering the different components with the numerical scales - enabling cost and time to be read off - that appear on the back and right walls. Hence, we decided to abandon the idea of using a single composite visualization to represent all the dimensions at this stage and instead use a set of single visualizations at the interface to represent separate dimensions. This is consistent with a range of literature showing that simple, conventional representations may have value over complex, novel ones (see, for example, Cox and Brna, 1993).
6. Design: High-tech prototypes
Having conducted a series of informal user studies to determine what were the best kinds of visualizations to use we then set about designing our hi-tech prototype system. The system comprises of the distributed interactive software and the physical shared workspace.
6.1 The interactive map planner and related components
We focused on what kinds of interactivity to provide that would enable both the customer and agent to easily take turns in building up a route using the map planner. We wanted customers to be able to interact with the map without the need for any training and importantly to feel comfortable doing so with an expert (i.e., the agent) looking on. We decided to use a simple drag-and-drop interaction style together with ‘fly out’ menus and checkboxes – both highly familiar actions and representations to GUI users. The map was designed so more detail could be zoomed in to and out of using the mouse buttons.
A graphic designer was also hired to create a professional and appealing look and feel of the interface. Considerable effort, over several iterations, went into designing the icons and menus representing the various products to be simple and aesthetic. The icons were also designed to be highly distinguishable from one another and easy to recognize. The type of transport planned from destination to destination was shown as distinctive lines with an icon of a plane or car ‘stamped’ on them, clearly showing whether it was car hire, train or plane. Figure 4 shows, to the left, a late prototype of the look and feel, and to the right, some of the final icons and maps used.
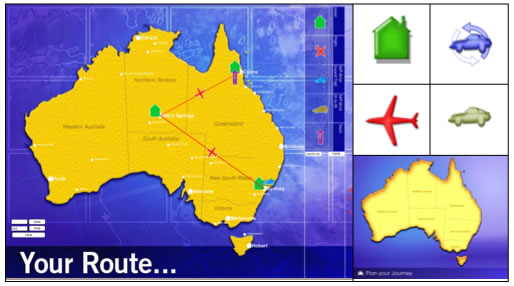
Figure 4. The look and feel of the planner prototype with icon palette
The interactive map planner prototype was iteratively developed with the travel agents. They made a number of recommendations about the design. For example, they pointed out how important branding and colour were for drawing in the customers and selling the products.
The travel planner was designed to enable the customers to explore a range of itineraries by themselves or with an agent. A series of introductory screens were designed showing various options that could be selected by the customer to help them with their initial planning (see Figure 6). On completion of these, three possible itineraries are then presented as starting points to choose from that further products can be added to or proposed ones changed. This process enables the customer and agent to quickly get started and have a shared reference point.
To develop further or edit one of the itineraries, icons representing the products are dragged and dropped from the palette. This results in one of the different product types (i.e., hotels, tours, hire cars) triggering a fly out menu showing contextually relevant options (e.g., choice of hotel type, dates and length of stay) as shown in Figure 5. The contextually relevant fly out menus were dynamically built from information delivered by the travel agent’s databases allowing selection of different product possibilities at that destination. The costs were also provided and could be dynamically updated.
When particular products are selected, the relevant brochure information appears on another screen, intended to help the user to make a decision on whether they will accept this product, which can then be configured (e.g. for dates and number of people) and the results added to the timeline and budget visualizations appearing on another screen. Flights are added in a similar way, except that these are dragged between, as well as onto, destinations. Products can be removed by simply dragging them off the map, or inserted at particular points. All the visualizations are appropriately updated simultaneously.
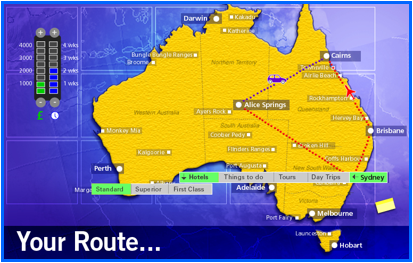
Figure 5. Screen shot of map planner showing a proposed route, a fly out menu for activities in Sydney and a further one for hotel types.
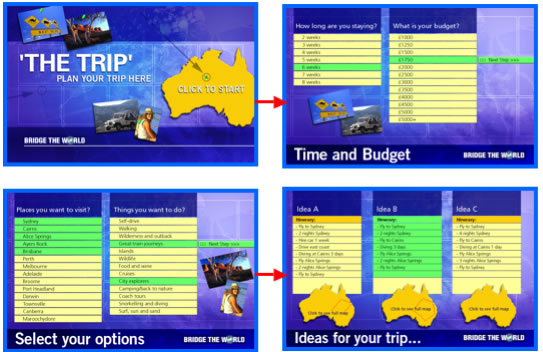
Figure 6. Introductory screen shots of the travel planner. The customer clicks on the map of Australia and is asked to selects options from the various menus that appear. The system then works out three itineraries based on the customer’s combination of options. Selecting one of these results in the full map planner (see figure 4) appearing on the display that is ready to append.
The other visualizations were designed to be updated automatically when the map was used. For example, when a hotel is selected at a location, relevant brochure information is displayed on another screen (see figure 7). When a hotel is configured (i.e. time and cost established through the menu) it is simultaneously inserted into the timeline and the budget (see figure 8). The four forms of information (map, budget, timeline, brochure pages) were dynalinked: changes in one representation had the effect of correspondingly making relevant updates to the others (see figure 9).
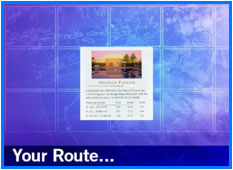
Figure 7. A contextually relevant page from the online brochure that pops up in response to a selection being made on the map planner.
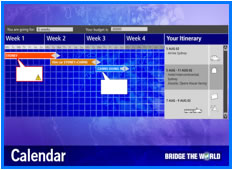
Figure 8. The timeline as it is automatically updated in relation to changes made to the map planner
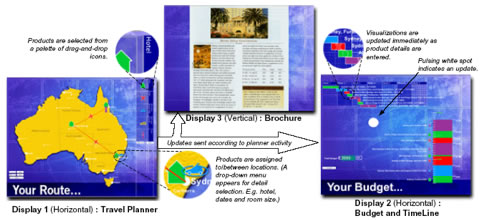
Figure 9. Dyna-linked representations of an early version of the travel planner: changes made to the map planner are automatically updated to show the effects in the other visualizations
Technically, the system architecture is distributed, but not complex. It was mainly implemented in Macromedia Director. Some Macromedia Flash was used. Databases, based on Bridge The World’s own, were implemented in Microsoft Access and queried using SQL. We made use of Director’s multi-user server to enable the system to be run off two (low specification) machines. The planner screen ran off one of these; the brochure screen and budget/timeline screen off the other. This distributed architecture was designed for two reasons: (1) to support the independent handling of several screens and displays; and (2) to be able to support scaling of various kinds to support different scenarios, for example simultaneous running of more than one eTable, or a greater number of screens. The `interactivity was handled by XML interfaces, and XML was also used to generate customer accounts with saved itineraries. Graphics were produced in Photoshop and Flash.
6.2 The design of the physical workspace: the eTable
Initially we experimented with using a large (1m2) horizontal back-projected shared display with the four types of information – map, budget, timeline, brochure – shown in separate windows (see figure 10). The windows could be promoted, demoted, minimized, maximized, resized and moved. People could sit or lean on/stand at the table. The asymmetric display location allowed an area for placing and working on paper-based pads and brochures. Interaction with the display surface was pen-based using a Mimio system.
An evaluation of the first version of the eTable was conducted with groups of three participants. They were asked to develop itineraries using various web resources and with certain constraints (e.g., a budget of 2500 pounds for a Japanese family of 4 visiting London for the first time). A control condition was also set up where the same resources were provided via a desktop PC. The findings showed more equitable participation and collaboration took place between the groups at the eTable compared with the PC (Rogers and Lindley, 2004).
However, a single display only allows for one screen of information to be displayed at any given time. A further user study using the travel planner on the eTable revealed that parts of it were hard to see by the participants working next to each other. Furthermore, the participants had to move the visualizations around in order to free space to look at others. This created a search problem: they had to remember where, for example, they had put the budget.
One way around these single display problems is to use multiple screens. They can be oriented in different ways so that those further away from users could be tilted toward them. We were interested in whether and how partitioning components of the same task across different screens affected a collaborative planning task. We wanted to explore whether there might be ways of linking multiple information visualizations in ways that would not increase cognitive load but decrease it. One way of achieving this is to ‘lock’ representations in specific spatial positions, so that their locations relative to each other remain persistent. If a person knows where to look for something, this can reduce search time considerably. In addition, both customers and agents can easily refer to the same object, rather than one collaborator having to work out what the other has done in a display. It also capitalises on the finding that coordination across different tasks in different locations is much more easily accomplished through switching gaze than by manipulating screens (Grudin, 2001).
The second version of the eTable was designed to have two embedded horizontal flat screen displays that were adjacent to each other, together with a third vertical screen behind them (see figure 11). We also explored how further displays could be added, such as ambient and personal displays, to convey other kinds of information, such as videos and travel codes (needed by the agent).
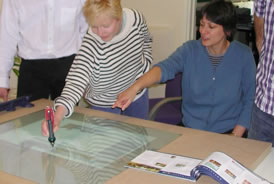
Figure 10. The first version of the eTable using horizontal shared screen and Mimio pen for input
Another advantage of having a multiple screen arrangement versus a large single-screen display is it affords greater privacy. Only those seated or standing near the eTable console can see the information and itineraries unfold on the two horizontal displays; an important consideration for use in a public space. Conversely a large display is more public and viewable from further away. The eTable was also customized as an oval shape, so that when the customer (this could be one or more) and agent sit in front of it they can more easily see each other and make eye contact. Sufficient surface space was also provided for a wireless mouse and keyboard together with room for placing other materials.
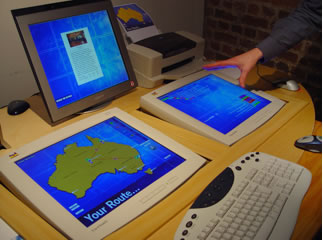
Figure 11. The second version of the eTable with three interlinked displays using wireless keyboard and mouse for input
7. Evaluations of the Oz Travel Planner and eTable in situ
The implementation of the final version of the Oz travel planner took several months to complete. It needed to be robust enough to be used in real time by the agents and their customers in the travel agency without any intervention from the researchers. Considerable effort went into debugging and testing it. It was also designed to be straightforward to start or reboot, requiring only a single click on an icon on the map planner screen for all screens to be activated.
To evaluate the Oz travel planner in an authentic setting we conducted a number of in situ user studies. Initially, it was used in various trade shows and then in the travel company’s flagship shop.
7.1 Trade show evaluation
The first user study took place at a large international travel trade show. The show was based in a large exhibition centre and lasted four days, having a throughput of many thousands of people, drawn from the general public and the travel business. Because of the importance of the event, the travel company was very concerned that our system appear professional on their stand and have the right look-and-feel and branding associated with the company (a specialist in Australian travel and purpose-built tours).
They positioned the eTable on the corner of their stand and embellished it with a large koala bear, piles of their travel brochures, posters and a vase of flowers. The effect was to make it an eye-catching showpiece (see Figure 12). This form of ‘window dressing’ proved to be very effective. All manner of people were attracted to the stand, including single business men/women, families, young and old people, couples and groups of friends, and disabled people. Over the four days, about 100 different groupings actually interacted with the Oz travel planner alongside a trained sales agent, who assisted them. Sometimes it was left to run unattended and experimented with by staff and members of the public.
The agents when shown the system quickly saw its potential in the context of their work (many not having seen or heard of it before). They were especially impressed by the interlinking of pages from the online brochures, the visual approach to building up an itinerary using the planner and being able to see the results of doing so dynamically appearing on the linked visualizations.
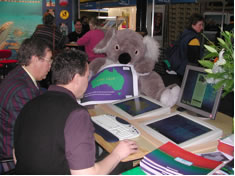
Figure 12. The Oz travel planner in use at a travel trade show
The people who approached the travel company stand were also drawn to the system. They would first watch others using it and then have a go themselves. There was no need to convince them to use it. The agents would invite them to sit or stand in front of it and then ask them where they would like to go. In general, each person/group and agent spent between 5 and 10 minutes working together, although some interactions lasted up to 30 minutes. Most were impressed by the system and several rival travel companies came over to see what the fuss was about. Moreover, many of the interactions resulted in complex itineraries being created and, in some cases, resulted in the passer-by handing over details to make an actual booking.
One unexpected outcome was how interacting with the visual travel planner brought aspects of the vacation alive – almost like providing a vicarious experience. The agents often gestured to parts of the display to describe what could be done in a particular place, how enjoyable a given activity was, why it was better to travel by train rather than car for a given stretch and so on. The customer would also gesture to various parts of the map whilst talking through a possible plan, indicating that they had been there already or they wanted to go to that part. Although the same effect, arguably, could be achieved through providing a paper-based map and brochures to refer to, having a dynamic map that could be zoomed in and out of, and an itinerary with costs superimposed on it, together with showing interlinked contextualized brochure pages of activities, provided a more congenial space, that encouraged both parties to talk about places in a more experiential way.
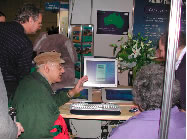
Figure 13. A deaf couple using the Oz travel planner with an agent on the right
Customers generally took an active role in specifying the components of an itinerary, suggesting different types of products (e.g., hotels, wine-tasting tours), and were interested in seeing how these affected their overall budget and plan. Conversation flowed freely and the agents often responded to the suggestions and requests put forward by the customer, reflecting less asymmetry and more sharing in the planning process. The customer frequently gestured towards information on the different screens when listening or talking and on some occasions took hold of the mouse to select options themselves. For example, a child of six sat down at the console, while his parents looked over his shoulder. No agent was present and the child started using it alone, treating it very much like a computer game, trying to ‘break’ the budget he’d previously set, by configuring a holiday that greatly exceeded it. He then started joining up all the destinations on the map, by placing plane icons on each of the cities and dragging them to the next city – a playfulness in interaction we had not expected. During the child’s play, the parents got drawn into the possibilities of travelling around Australia to the extent they went off to talk to a sales agent about a possible vacation.
The system also could empower various (potentially excluded) parties. For example, on discovering that one couple was deaf, the agent made much more of the interactive planner and visualizations, gesturing and pointing to the changes on the screen, as if to let the representations ‘speak’ for themselves (see figure 13). The couple, meanwhile, nodded and reciprocated in gesturing at the screens, and even pointed to the mouse when they wished to interact with the visualizations. Such an ad hoc way of using the system provided a novel way of visually communicating.
The physical design of the console table enabled the agent and customer to sit down and interact together in relative comfort. Moreover, it seemed that the eTable was able to reduce some of the social awkwardness that arises when two strangers first meet. Enabling them to sit side by side meant that there was less of an expectation for direct eye contact. Instead, attention was focused on the displays in front of them. This allowed the two parties to talk about what was happening on the screens, rather than having to look directly at each other, which is what often makes strangers feel uncomfortable. At the same time the shared representations reduced the need for agents to leave customers alone in order to concentrate on their screen and to have to translate what they were doing. The effect was to create a more congenial and less formal set-up than the initial encounters we had observed in the travel agents. Customers seemed to quickly settle down and feel relaxed (as indicated by their body postures and manner of talking). We also observed evidence of continuous rather than interrupted interaction, where both parties played a more equal role and interaction was more free-flowing. There was much joking and high spirits between the two parties, conveying a lightheartedness that helped the two parties collaborate. When asked afterwards, many of the agents commented on how much easier they had found it to build up a rapport with the customer.
Having multiple displays helped the parties focus and attend to the information in front of them in appropriate ways. The agents rapidly learnt which screens to look at next (such as looking at screen 3, after making a selection for a hotel in the planner pop-up calendar dialog box in screen 1) and guided the customer in their navigation through the displays, through changing their gaze or pointing. The customer also quickly learnt to associate the effects of carrying out an interaction in one screen with another, turning their attention to the changes occurring in the budget and time visualizations following the addition or subtraction of a component to the planner. The linked visualizations and shared representations helped both parties keep better track of how the product was developing, through reducing cognitive load.
Collaboration between agent and customer tended to be fluid in nature. While the agent predominantly controlled the interaction with the system, the customers often made suggestions as to what to do next. For example, they might suggest to try another kind of hotel or go on a sightseeing tour of Sydney. Hence, there was evidence of joint planning, where the person ‘driving’ the system would effectively hand over control of the planning to the customer, and then take it back again to show another suggestion. Thus the physical design helped reduce the physical asymmetry we saw in the current arrangement.
Preliminary itineraries were in most cases created relatively quickly and easily. This encouraged the agent and client to explore a range of possibilities, enabling them to compare having different ordering of locations, choice of activities and ways of travelling around Australia. Having a wider set of possibilities is very useful later in the transaction where substitutions may need to be made because of booking issues. It also helps the customer make more of an informed choice.
The findings from the system being used at the various trade shows were very positive. However, the transactions that take place at a trade show are quite different from those that take place in the day-to-day running of a travel shop. A primary objective at a trade show is to promote the company and its products to potential customers and rival companies whereas in the shop it is primarily about making bookings. Our next evaluation of the system was aimed at how it would be used in a shop setting.
7.2 Shop-based evaluation
The second trenche of evaluation was conducted in the travel company’s flagship shop in London UK. The Oz travel planner and eTable were installed in a corner of the shop for a period of over four months (see Figure 14). Agents were encouraged to use it when they felt it would be appropriate and useful. In addition, the agency held invites-only promotion evenings called ‘Oz Nights’ at the store for existing customers, specifically to promote Australia as a tourist destination, where the Oz travel planner was also demonstrated.
One major difference from the trade show setting was the pressures and concerns agents have when their income directly depends on what they do with their time, day by day, in a commission-based setting (i.e. the agents have to sell products and hit targets to get paid a certain amount at the end of the month). As a consequence the system was used less in the store during regular hours, being largely championed by one particular agent. Similar to the trade show it was used much more during the Oz Nights, where commission was not an issue.
Two contrasting findings were that, firstly, there was a distinctive adoption pattern amongst agents – most were wary with the exception of one or two and, secondly, customers were, without exception, intrigued and enthusiastic about the system. Despite the agents’ positive responses towards the potential of the Oz travel planner, in a daily setting they had three concerns: (1) ‘time is money’ (clearly and explicitly expressed) and the use of the system was seen as an additional time investment; (2) issues to do with their personal presentation, particularly the possibility of customers realising that they were working with a new system and what that might mean; and (3) expectations of functionality which the prototype did not feature.
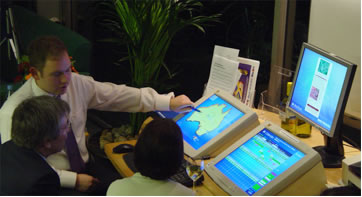
Figure 14. The Oz travel planner in use at the store by agent and two customers during an Oz night
When first encountering the system, the agents showed a ‘dissociation’. By dissociation, is meant that the agents made it clear to the customers from the outset that what they were doing was not part of what they normally do, thus excusing any errors or difficulties. For example:
“It’s our new machine. It can give you some good ideas about what you can do in Australia”
“I’m not sure it is really going to be helpful, maybe we should look at a map instead”
‘This is called the Oz Planner and it’s a way of linking up an itinerary around Australia”.
The comments are about the system itself rather than focussing on the content of a holiday. Frequently, agents would draw attention to specific problems or speak aloud their interactions:
“Oh, I’ve put in the wrong date”
“How do I do car hire?”
“OK. Let’s drag a car onto Sydney here”
“We can zoom in here”.
Although the agents were enthusiastic about the Oz travel planner at the beginning understandably they were somewhat nervous about using it. For example, when interviewed, one agent, Gary, clearly expressed dissatisfaction with his own performance: “I ended up feeling like I was filling up the silence while I was fiddling about, I mean normally you’ll just concentrate on exactly what you want to say”…”I think I would have sensed if I started to look stupid and that is why I called a halt to it”.
However, after a few weeks of further use of the system, the agents became more familiar with it and some found ways of integrating it into their existing practice. They were also able to appropriate in ways not anticipated: for example. Gary was able to start using it to evoke vacation experiences. Agents recognise that a big part of selling a holiday is to be able to sell a product by describing it compellingly. However, much of their interaction with customers is taken up with planning issues before they can reach this stage. Gary saw the potential of the travel planner to get to this stage more quickly. For example, he showed customers a range of hotels in Sydney using the pull-down menu on this location which triggered different brochure images, ending with the one he hoped to sell them, which featured “a really amazing glass bridge over the harbour, so you walk to your room and look down into the water”.
Customers were without exception extremely positive about the system when first encountering it and during subsequent uses. They were interviewed following their interactions with it on several occasions. The dissociation agents conveyed at the beginning did not appear to affect their experience of the interaction negatively, or make them think less of the agents, e.g.,
“X was very professional. The visuals were very good, but it is clearly dependent on X’s expertise”
“It’s the mix of electronic data and personality that makes it work… it’s the human interface thing which I think is key”.
At the same time, customers often praised the system during their use of it:
‘’I love these interactive things I must say! It’s fantastic!’
We also interviewed them in their homes some time after using the travel planner. They were able to remember in detail the itineraries they put together and also the evocations of places and experiences.
In sum, the agents overcame their initial fears of using the system and found beneficial ways of integrating it within their working practice while the customers were very positive about their interactions with it from the outset and subsequent uses.
8. Conclusions
This case study has illustrated a full design cycle in action, including initial problem space, ethnographic study, the iterative design of low and high tech prototypes, and in situ user studies. It showed how the design, development and deployment of a novel interactional workspace could facilitate new forms of working between customers and agents. It also highlighted salient research findings and their implications.
The project focused not just on the design of a software application but also its integration with a new shared workspace. This involved considering cognitive, social, physical and technological aspects during the design process. A number of physical and paper prototypes were built and tested in the lab and the findings used to inform the final design. The various evaluations also showed how the system was appropriated in different settings, highlighting how contextual factors are important to the success of introducing a novel technology into an established work practice.
While the Oz travel planner was developed for a specific application of use (i.e., Australian trips) the project raises a number of general research and design issues including:
- how to design readable and effective visualizations
- how to integrate separate different displays of information so that it is easy for users to know where to look and follow different strands/threads of ongoing activity
- how to design physical-technological workspaces that can promote collaboration and equitable participation
- how novel technologies are adopted in existing practices
Design implications arising from our research include:
- Allowing people to refer to the same graphical representations makes it easier for both parties to take turns in developing the complex product
- Coupling the creation of a product with the dynamic display of relevant information enables the transaction process to be more fluid
- Partitioning information across screens allows multiple parameters and complex relations to be followed and readily interpreted
- Providing dynamically linked external representations of the dependencies between different parameters enables a broad range of alternatives to be explored and compared
- Mapping different types of information to particular displays helps guide people’s attention to where to look at a given stage of the transaction
9. Acknowledgements
The case study is dedicated to the late Mike Scaife who was a principal investigator on the project and an inspiration to us all. We would especially like to thank our collaborators from Nottingham University, Tom Rodden and Ian Taylor. We are also indebted to Mia Underwood and Matt Davies for their graphic designs; Eric Harris for coordinating the building of the final eTable; Sian Lindley for conducting user studies with the first version of the eTable; and Jerry Bridge, James Bell and Gillian Hughes at Bridge the World for making it possible. Finally, we would like to thank the UK ESRC/EPSRC PACCIT programme for funding the research.
10. Key publications
Halloran, J., Rogers, Y., Rodden, T. and Taylor, I. (2003) Creating new user experiences to enhance collaboration. Proc. INTERACT'03, Zurich, September 2003. 479-486.
Rodden, T., Rogers, Y., Halloran, J., and Taylor, I, (2003) Designing novel interactional workspaces to support face-to-face consultations. Proc CHI'03. ACM Press. 57-64.
Rogers, Y. and Rodden, T. (2003) Configuring spaces and surfaces to support collaborative interactions In O’ Hara, K., Perry, M., Churchill, E. and Russell, D. (eds.) Public and Situated Displays. Kluwer Publishers, 45-79.
Scaife, M., Halloran, J. and Rogers, Y. (2002) Let’s work together: supporting two-party collaborations with new forms of shared interactive representations. In Proc. COOP’2002, Nice, France, August 2002, IOS Press, The Netherlands, 123-138.
11. References
Cox, R., and Brna, P. (1993) Reasoning with external representations: supporting the stages of selection, construction and use. In P. Brna, S. Ohlsson and H. Pain (Eds) Proceedings of the World Conference on Artificial Intelligence in Education, Charlottesville, VA: Association for the Advancement of Computing in Education, 185-192.
Dietz, P. and Leigh, D. (2001) DiamondTouch: a multi-user touch technology. In Proc. UIST’01, ACM, 219-226.
Greenbaum, J., and Kyng, M. (1991) Design at Work: Cooperative Design of Computer Systems. Lawrence Erlbaum Assoc., Mahwah, NJ.
Grudin, J. (2001) Partitioning digital worlds: focal and peripheral awareness in multiple monitor use. In Proc. CHI 2001, ACM, 458-465.
Hascoet, M. and Sacks, F. (2002) Exploring interaction strategies with Wall-screen. In Proc. IV’02, IEEE, 719-724.
Heath, C. and Luff, P. (2000) Technology in Action. Cambridge: Cambridge University Press.
Huang, E.M. and Mynatt, E.D. (2003) Semi-public displays for small, co-located groups. In Proc. of CHI’2003, ACM, 49-56.
Hughes, J., O’Brien, J., Randall, D., Rodden, T., Rouncefield, M., Sommerville, I. and Tolmie, P. (1999) Getting to know the ‘customer in the machine’. In Proc Group 1999, 30-39.
Izadi, S, Brignull, H., Rodden, T., Rogers, Y. and Underwood, M. (2003) Dynamo: A public interactive surface supporting the cooperative sharing and exchange of media. In Proc. UIST ACM, 159-168.
Johanson, B., Fox, A., and Winograd, T. (2002) The interactive workspaces project: experiences with ubiquitous computing rooms. IEEE Pervasive Computing 1, 2, 67-74.
Luff, P. and Jirotka, M. (1998) Interactional resources for the support of collaborative activities. In Ishida, T. (Ed.) Community, Computing and Support Systems. Springer, 249-266.
Nunamaker, J. F., Dennis, A. R., Valacich, J. S., Vogel, D. and George, J. F. (1991) Electronic meeting systems to support group work. Comm. of the ACM 34, 7, 40-61.
O’Hara, K., Perry, M., Churchill, E. and Russell, D. (Eds.) (2003) Public and Situated Displays. Kluwer Publishers.
Rogers, Y and Lindley, S. (2004) Collaborating around vertical and horizontal displays: which way is best? Interacting With Computers, 16, 1133-1152.
Rogers, Y., Lim, Y. and Hazlewood, W. (2006) Extending Tabletops to Support Flexible Collaborative Interactions. In Proceedings of Tabletop 2006, IEEE, 71-78.
Scaife, M. and Rogers, Y. (1996) External cognition: how do graphical representations work? International Journal of Human-Computer Studies, 45, 185-213.
Shen, C., Esenther, A., Forlines, C. and Ryall, K. (2006) Three Modes of Multi-Surface Interaction and Visualization, In Proc. of CHI 2006, ACM.
Stefik, M., Foster, G., Bobrow, D. G., Kahn, K., Lanning, S. and Suchman, L. (1987) Beyond the chalkboard: computer support for collaboration and problem solving in meetings. Comm. of the ACM, 30, 1, 32-47.
Streitz, N.A., Geißler, J., Holmer, T., Konomi, S., Müller-Tomfelde, C., Reischl, W., Rexroth, P., Seitz, P., and Steinmetz, R. (1999) i-LAND: an interactive landscape for creativity and innovation. In Proc. CHI 1999, ACM, 120-127.
Streitz, N.A., Tandler, P., Muller-Tomfelde, C. and Konomi, S. Toward the next generation of human-computer interaction based on an integrated design of real and virtual worlds. In J. Carroll (ed), Human-Computer Interaction in the New Millennium, Addison-Wesley, 2002, 553-578.
Tan, D.S. and Czerwinski, M. (2003) Effects of Visual Separation and Physical Discontinuities when Distributing Information across Multiple Displays, In M. Rauterberg et al. (Eds.), Human-Computer Interaction–INTERACT '03, IOS Press, 252-255.