|
Overview
This case study focuses on an investigation into the use of ATMs (Automated Teller Machines) in Mumbai, India. It illustrates the use of ethnographic data to answer questions such as: ‘‘What is the general attitude towards ATMs use?’’ and ‘‘What problems do people face when using ATMs?’’
The project involved data collection through field observations and semi-structured interviews with early ATM adopters, bank customers who do not use the ATM, and customers who used the ATM for the first time during this study. Over 40 interviews were recorded, and photographs and videos were taken where possible. In addition, user profiles representing six different social classes were generated. Together with observations of ATM usage the project collected a considerable amount of data.
The project’s use of affinity diagrams to help analyze the information that they collected is described by De Angeli et al. (2004). The affinity diagram (see Figure 1 for an example) which is used in contextual design (Beyer and Holtzblatt, 1998) aims to organize individual ideas and insights into a hierarchy showing common structures and themes. Notes are grouped together because they are similar in some fashion. The groups are not predefined, but must emerge from the data. The process was originally introduced into the software quality community from Japan, where it is regarded as one of the seven quality processes. The affinity diagram is built by a process of induction. One note is put up first, and then the team searches for other notes that are related in some way.
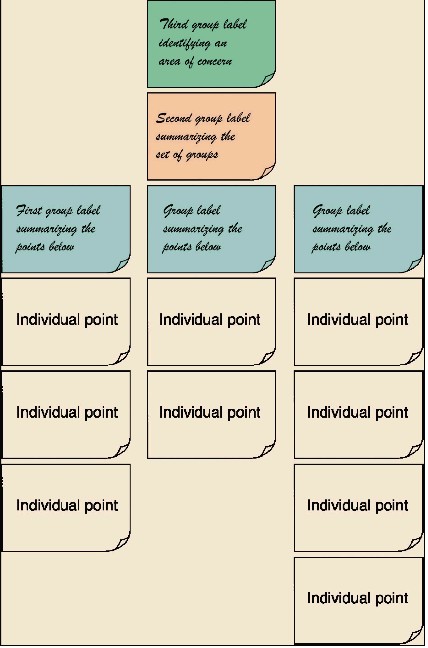
Figure 1 The structure of an affinity diagram
The affinity diagram organized the insights, ideas, and cultural influences gathered during the interviews and observations into a set of 10 top-level categories including perceptions of ATMs, banking habits, what people do while waiting in banks, and social and language barriers to banking (see Figure 2). Using the affinity diagram technique also highlighted some opposite behaviors. For example, two women who both wanted to avoid temptation (that of spending too much money) had different attitudes to the ATM. One used the ATM routinely but only to draw out enough cash to cover her immediate requirements. The other felt that having 24-hour access to cash was too much of a temptation in itself.
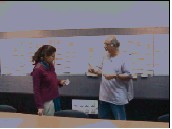
Figure 2 Building the affinity diagram of Indian ATM usage
References
De Angeli, A., Athavankar, U., Joshi, A., Coventry, L. and Johnson, G.I. (2004) Introducing ATMs in India: a contextual inquiry. Interacting with Computers 16(1), 29–44.
Beyer, H. and Holtzblatt, K. (1998) Contextual Design: Defining Customer-Centered Systems. Morgan Kauffman, San Francisco.
|
|